SaaS Nerd Alert: Yeeeeeeeee! It’s my fav post of the year, and the most challenging part is choosing only 10 highlights, so, as usual, I’m taking it to 11. KeyBanc Capital Markets (KBCM) are back again for their (13th) annual SaaS survey for Private Markets (download the PDF here). This report includes responses from senior executives across SaaS companies at various stages, and we are seeing a rebound in growth as companies recover from the economic disruptions caused by COVID-19. Why should you care? This is data from Private Companies - of which about 20% are less than $5M in ARR, and about 40% are less than $10M - sound like you?
WORD OF CAUTION: The number of respondents has dropped significantly this year: 110 vs. 354 last year and 424 in 2019 (the 2020 count is confusing as they had to run it twice - a COVID thing).
1. PRICING:
Only 41% of SaaS Companies priced by seat. (You may have seen my "occasional" posts on Consumption-Based pricing from time to time in this newsletter). An interesting note is that this survey now includes varying segments beyond B2B and B2C - such as B2D (D for Developers) and API companies. Which reflects the evolving tech/SaaS landscape.
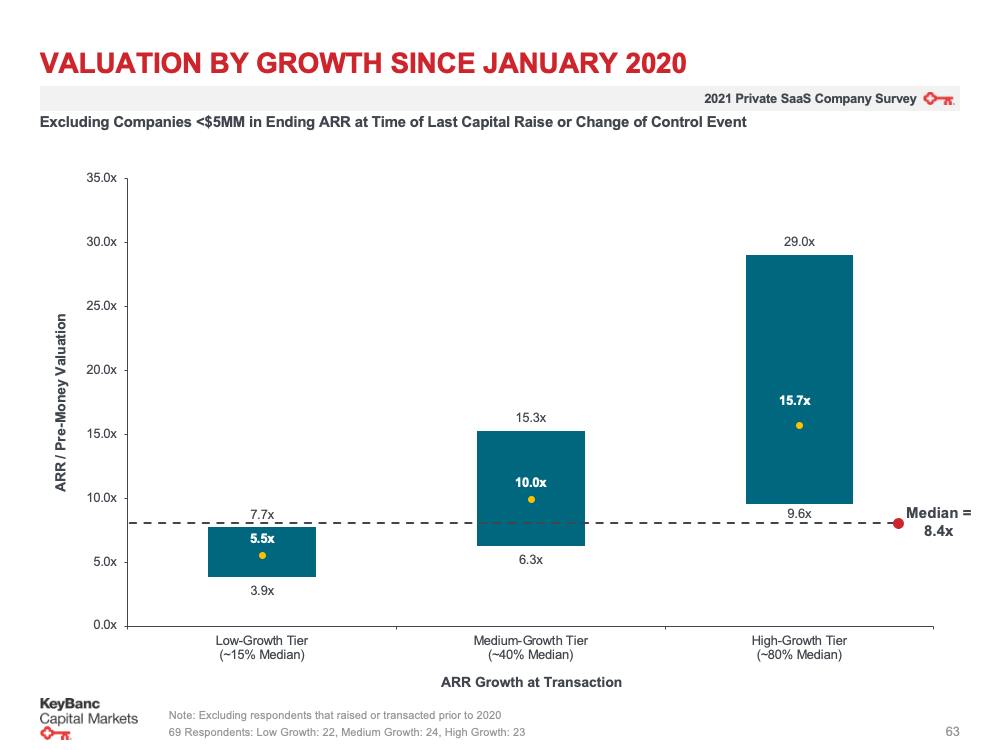
2. VALUATIONS:
This is a new metric measured starting from last year - The median enterprise value of companies surveyed last year was 8.4x ARR (at the time of the liquidity event), which had quite a bit of variation and a strong relationship between valuations and top-line growth. This year, shockingly to no one, valuations are down to 6.1x ARR (based on their most recent round).
3. SALES:
The primary mode of Sales efforts remains Field Sales based. 59% for companies with more than $5 ARR and 73% for companies under $5m ARR. Inside Sales took the second largest chunk (22% and 14% respectively). But the complimentary slide to this is the distribution of method by deal size anything greater than $250k is all "Field Sales" - but assume a lot here is now Zoom-led.
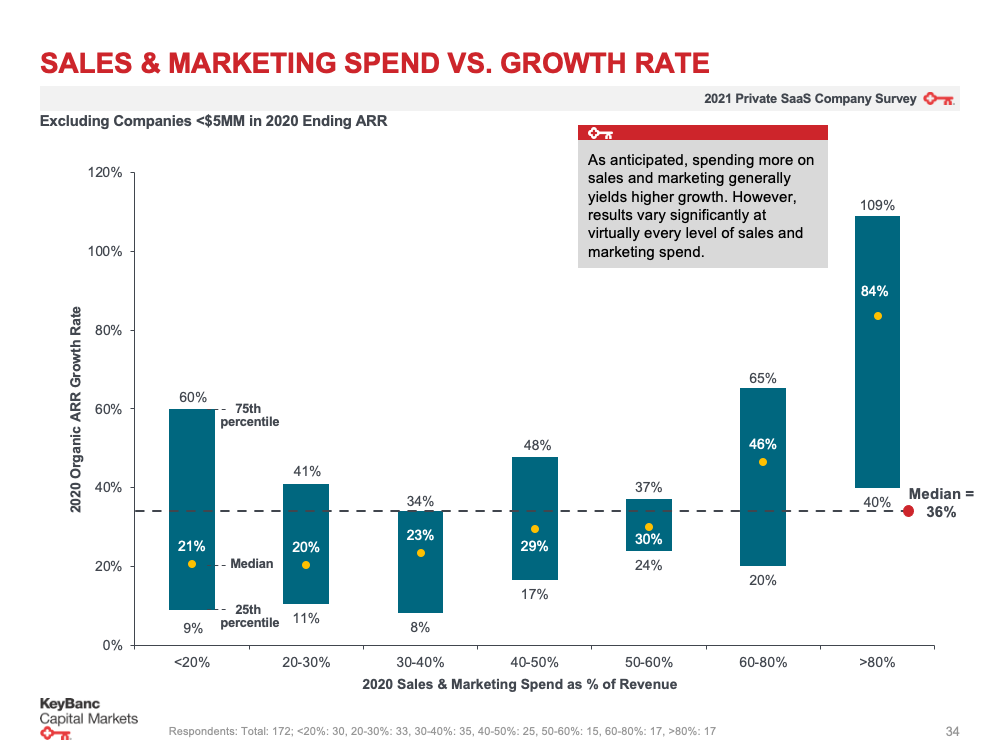
4. MARKETING SPEND:
Figuring out how to optimize marketing spend and growth rate is a crucial question, and this study doesn't show the benchmarks marketers want to hear: Results vary. While the median sales and marketing spend has dropped this year to 31% of revenue (down from 36%), to ramp up ARR growth, you gotta blow a lot more dough relative to revenue: the percentage of revenue in isn't much more than percentage growth spend out.
5. GROWTH:
The 2021 growth levels were back up to a healthier 31% as the COVID disruptions settled (2020 was 20%!). This year is an ARR growth of 31%, and forecasts are always a few points more optimistic - still at the same 36% seen in 2021 and 2019. BONUS - you can see how that 31% is split by industry categories here.
6. CAC:
This one is always nuanced. The report always breaks CAC down into blended, new, and up-sell/expansion so you can see the efficacy of spend to return. The median blended CAC comes in exactly the same as last year - $1.20 for every $1 of revenue realized. FYI it was $1.10 in 2019 and ($1.32) in 2020. New Customer CAC is up significantly YoY and at $1.78: 2021 ($1.67), 2020 ( $1.60), and 2019 ($1.34). This signals two things: 1. SaaS is increasingly competitive, and 2. CAC Payback is getting way longer. Upsell/cross-sell (see below) is still cheap at $0.61 per $1 of ARR earned (and down from $0.63 last year).
7. CAC PAYBACK:
CAC is also a measure of cash profitability per customer - and this negative trough is long, so take a seat! New customers, on average, take 2 years and 2 months to become profitable. This highlights a deepening dependency on access to capital to fund a SaaS company's growth through these SaaS Cash Flow troughs.
8. DISCOUNTS:
If you are part of the great SaaS Ponzi Scheme like me, it may be no surprise that annual+ contracts are discounted. But how much? 8% is the median annually, and 10% on multi-year.
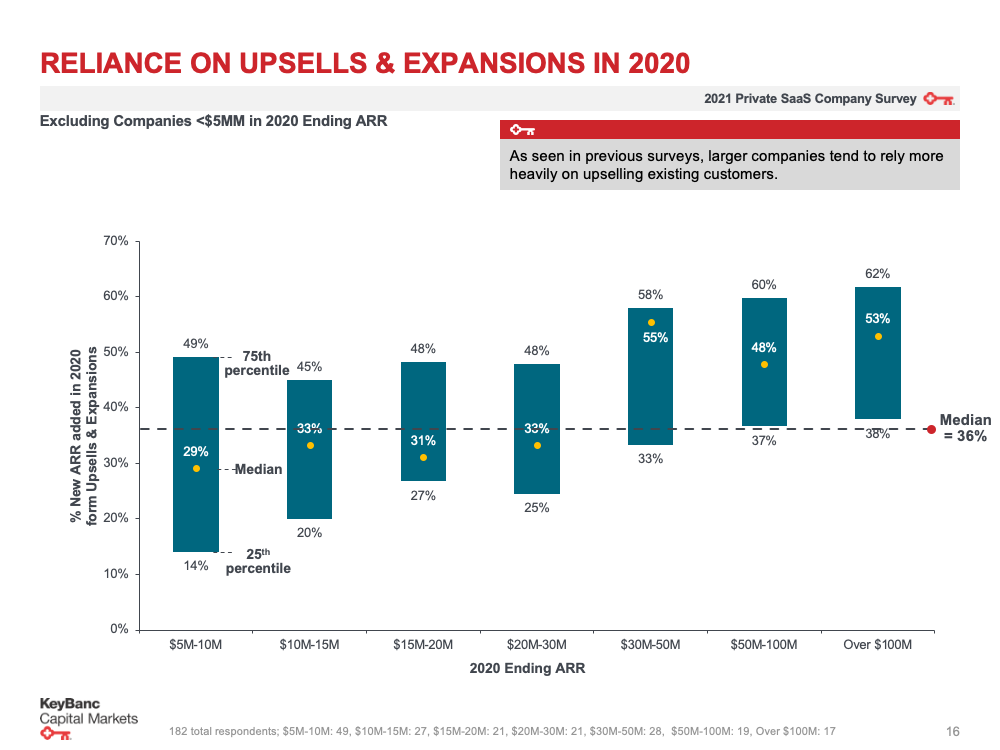
9. CROSS SELL/UPSELL:
This one is interesting as it is way higher than the 36% last year: 46% of new ARR bookings are attributable to cross-sell/up-sell activities. Larger companies use this strategy more heavily than their smaller counterparts (2x more). This is likely due to not relying so heavily on acquisition as the business matures.
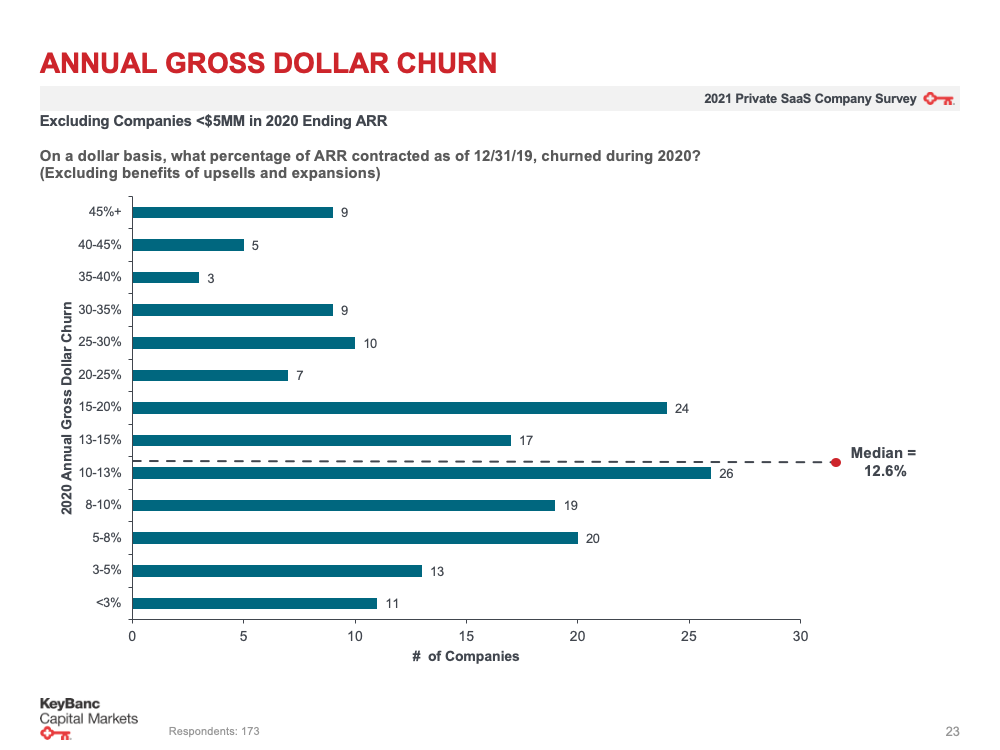
10. CHURN:
Yeah - this one is a big problem, folks. The report for last year recognizes a YoY trend of a dollar churn decrease back to 12.6% (same as 2020). Which is also similar to 2019 levels (12.5%). This year: 14%. Luckily cross-sell upsell offsets this somewhat. Note that NDR is in the middle - 109%.
11. ARR per FTE:
Capital Efficiency is a new metric we all want to track in these LeanOps times. This number is $143K per FTE. With public companies, it's double that, according to data from Maritech.