Last month I reviewed the KeyBanc Capital Markets 13th annual SaaS survey for Private Markets (you can download it here) and offered a warning as the number of respondents has dropped significantly: Now 110 vs. 424 in 2019.
Another player in town, Openview, is also benchmarking privately held SaaS businesses with a PLG Lens. Their 2022 SaaS Benchmarks Report has a much broader sample size and combines over 3,000 respondents’ results (and 660 this year) which make up this week’s Top 10 (and can be downloaded here as a PDF); it’s a much different story than in 2021 - but we still take it to 11:
1. GROSS RETENTION:
OpenView's SaaS survey found that early-stage companies ($2.5m to $10m ARR) are seeing gross retention decrease relative to 2021. Those earlier-stage businesses should be focused on Churn as a primary KPI. PLG lead companies see best-in-class retention (128%) and have highly efficient growth engines (63% Rule of 40).
2. BURN:
2022 values profitability over growth rate, and most companies are cutting burn, regardless of cash runway or Growth Rate (see why with #3 below). LeanOps is the whiplash to what is happening both in the VC world and Public Market - also reflected by the rapid handbrake on minted Unicorns from Q4 '21 to Q3 '22 (from 139 to 24).
3. RULE OF 40:
In 2021, OpenView observed that "investors have forgotten all about the Rule of 40." This year's response: the Rule of 40 "back from the dead." Cash is no longer cheap, and multiples have plummeted. Efficient Groth Engines and LeanOps practices are essential - PLG lead companies also stand out in this category with 63% tracking with the Rule of 40).
4. FINOPS:
This slide could be a newsletter all in itself. A very meaty section that breaks down core FINOPS metrics by stage - headcount, funding amount, ARR, etc. This shows what it takes to raise funding in today's environment (Bold numbers are median performance).
5. CAC PAYBACK:
According to KeyBancs report, New customers, on average, take 2 years and 2 months to become profitable. OpenView has a different take, and the answer depends on the market. Companies selling to consumers/SMB segment have shorter buying cycles/lower CACs than those selling to enterprise customers, and PLG outperform their peers (again).
6. NET DOLLAR RETENTION:
This metric can be paired with #5 above. Being strong in both these metrics allows you to fuel high growth and stay efficient. Growing and staying efficient is only possible if you're strong in these two metrics. Great NDR is 116% in SMB and 125% in Enterprise.
7. REVERSE TRIALS:
This is a crucial lever with those of us at PLG-Land: Reverse Trials allow users to try premium features during the trial. Companies are maximizing the upfront value for users and increasing the likelihood they will convert through usage paywalls.
8. PRICING:
Just like Software Products - pricing is never done. 61% of the companies surveyed adjusted pricing in the last year, and, on average, this resulted in a 27% lift in ARR. Side note in that slide: 55% of respondents have at least tested usage-based pricing.
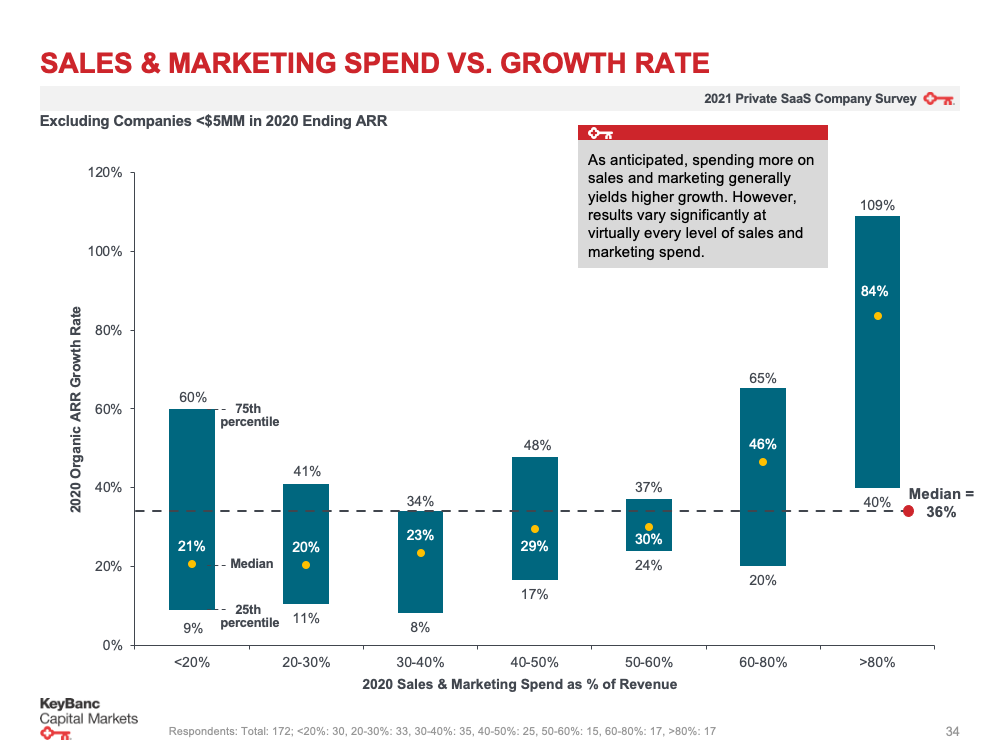
9. SALES AND MARKETING:
This is similar to KeyBanc, who noted marketing spend has dropped this year to 31% of ARR (down from 36%) KeyBanc correlates Sales and Marketing Spend to Growth Rates, whereas OpenView separate spend based on stage (33% average across the board though). Both methods are interesting benchmarks. Sales employees range from 10-20% of all staff across the revenue stage - but that percentage increases at the higher end of town.
10, EMPLOYEE DISTRIBUTION: Across all companies, Engineering is consistently the largest department, Customer Success and Product at about 10%, and Marketing at only 7%. This slide also has median headcount by stage - which is a great metric to track.
11. REPRESENTATION:
Or Women-Led Growth: Less than one-third of leadership roles are filled by women at most early-stage companies. Here is the kicker: EVERY BUSINESS with at least one-third of the team women has a greater growth rate than those that don't, regardless of stage.